
Accounting for the Exploding Profits of Turkish Firms | A Winter Unlike Any Other

Section I: Accounting for the Exploding Profits of Turkish Firms
Executive Summary
Turkish firms made a ton of money in Q2-2022.
The excess profits they made were almost entirely related to inventories and inventory pricing.
This bump in profits is probably fleeting.
Since the Turkish GDP figures were released on August 31, we could observe something that we can’t recall observing ever before in the Turkish Econosphere:
People who have never once talked about the nuts and bolts of the GDP and how equitable a growth path is, started to talk about both. Needless to say, we welcomed both of these developments. It’s always good that more people are interested in how the sausage is made and the distribution of incomes in an economy is possibly the most important element of the social contract.
Why did these auspicious things happen?
Because, according to the GDP figures, Turkish firms made an absolutely crazy amount of money in the second quarter of 2022, and Turkish workers made less. A lot less than usual.

Source: TurkStat, Galata Chronicles’ calculations
Naturally, the ensuing discourse was that the 7.6 percent Turkish GDP growth observed in the second quarter was of the reverse-Robin-Hood kind: It took from the poor and gave the rich.
Let’s get one thing out of the way first: It is very difficult to definitively arrive at that conclusion by just looking at this chart because it doesn’t include the household dividend and interest incomes. And we won’t have those figures for two more years, unfortunately.
However, it wouldn’t be an extreme reach to conclude that even with those additional incomes accounted for, households’ share of the GDP declined significantly because the gap is so large, and wage laborers definitely got the short end of the stick as dividend and interest income is significantly correlated with overall income. (That is a nicer way of saying “minimum wage earners probably don’t have a ton of equity investments and money in the bank”)
Now, to answer the question of why this happened, we need to decompose the current profits and labor income into two components: Deflator and real.
TurkStat unfortunately doesn’t publish a real GDP by income series, but we can use the hourly labor cost data published as part of the employment statistics and deflate the labor income series with current prices in the GDP data. Since GDP by income basically consists of three components, labor income, gross profits and taxes-subsidies, and since we know the last part’s deflated version from the GDP by production data, we can now have all three of the real components (not seasonally adjusted).
In the chart below, we can observe that there is indeed a divergence between the growth rates of real labor income and gross profits, but it’s not sufficiently large to explain the significant change since Q3-2020.

Source: TurkStat, CBRT, Galata Chronicles’ calculations
And if we check the real labor and real gross profit shares, there is an apparent long-term trend of labor receiving less and less, but again, this doesn’t explain the tectonic shift we saw above. If anything, the real share is pretty much constant for the last 4 years.
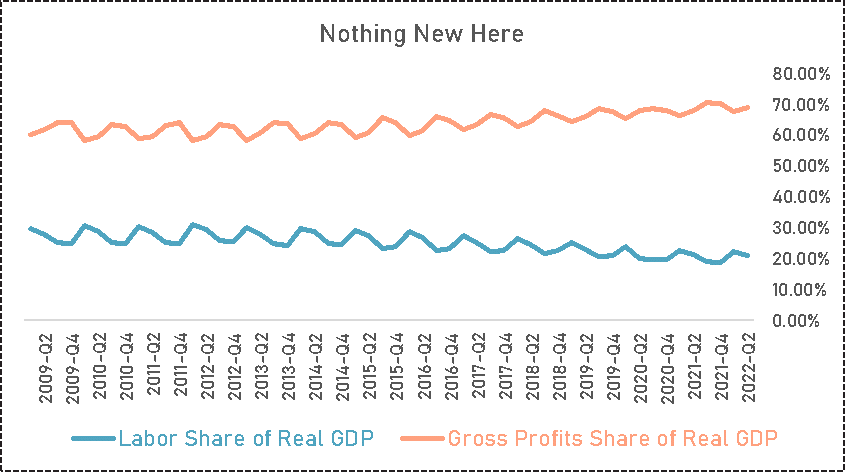
Source: TurkStat, Galata Chronicles’ calculations
Therefore we need to take a look at the remaining part of the equation that is the deflators, and when we do, what we see is breathtaking.

Source: TurkStat, CBRT, Galata Chronicles’ calculations
Now this DEFINITELY does explain the striking shift in the distributions. Remember folks, this is the value added we’re talking about here, so the cost of intermediate goods/inputs, commodity prices, etc. don’t matter here. The arrow of causality is of course an interesting question, whether firms hiking prices caused inflation or vice versa. Again, unfortunately, we won’t have the necessary balance sheet data for a couple more years until CBRT publishes it, so until then we will have to make do with what we have and that is the stock market data. It has to be noted that the composition of the XU100 and the overall economy is pretty different so any conclusion derived from this has to be tentative at best. And that conclusion is, Turkish firms increased their prices more than their costs.

Source: Bloomberg (Last observation: September 13, 2022)
Now let’s move on to the main argument of this article: The primary driver of the stupefying rise in the overall profits of Turkish firms in the last couple of quarters is the inventory build-up, and the trajectory of the prices associated with said inventories.
A disclaimer first: For TurkStat and many other statistical agencies around the world, inventories in GDP is a residual item, and is basically the difference between the GDP by production and GDP by expenditure series, unlike inventories in the US GDP figures, which Bureau of Labor Statistics tries to measure. So in the case of BLS you get inventories and the remaining differences between different GDP measurement methods are recorded as “statistical discrepancy” and in the case of TurkStat and many others, you only get “inventories”.
To show that the rise in profits is in fact mainly because of the move in inventories and prices, we need to quantify things, so bear with us while we do a bit of math:

If we reflate the real change in inventories with the “GDP by expenditure minus the change in inventories” deflator, which is what we called “consumer prices” above, we calculated, we get:

Since real GDP is indexed to 2009, producer and consumer prices in 2009 are the same, so the equation above simplifies to:

And if we take the difference of the Change in Inventories (Current Prices) equation and this, we get:

This was what we were looking for, an equation for the amount of profits Turkish firms made in Q2-2022 attributable to their pricing of their inventories. When we take a glance at the share of such profits in the total gross profits, this whole thing starts to make a lot more sense:

Source: TurkStat, CBRT, Galata Chronicles’ calculations
The story of the Turkish Banking Sector actually doing banking basically starts after the global crisis, and we can see that pattern in this chart. Since firms couldn’t finance inventory accumulation before the crisis with bank loans, there weren’t any inventory pricing profits to speak of. But after that, they started to receive loans and finance inventory. And in the last two quarters, this behavior hit a fever pitch with deeply negative real interest rates helping firms basically build up inventory for free so they did regardless of the price. That’s why the local regulators are trying to curb the flow of commercial loans for working capital management purposes lately, because this behavior was a crucial reason why we observed what we observed in Turkish CPI for the last 5-6 months.
If we go ahead and subtract this from their gross profits, the entirety of the explosion in profits and how much firms receive out of the GDP disappears:
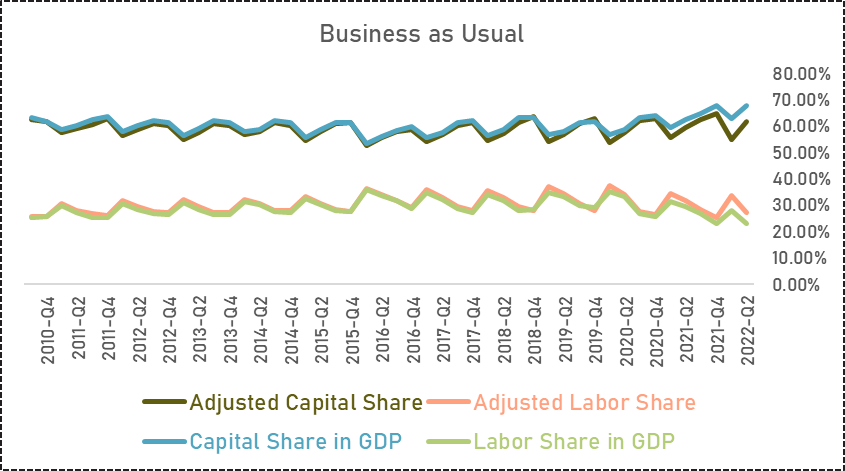
Source: TurkStat, CBRT, Galata Chronicles’ calculations
With this adjustment, things that don’t make sense, like why are Turkish firms not ramping up investments despite record profits and remarkably strong domestic and global demand, start to make sense as well. Because as it turns out, they do:

Source: TurkStat, CBRT, Galata Chronicles’ calculations
This chart tells us that Turkish firms are treating these inventory pricing-related profits like something fleeting, as they should. The minimum wage hike in July probably ate a chunk of the excess profits and if price expectations get re-anchored anytime in the future or they fail to renew their working capital loans, this path might get costly for a quarter or two. So they invest out of what they will have, not what they do now.
Section II: A Winter Unlike Any Other
Executive Summary
Turkish Airlines will continue to recover strongly, despite the monthly slowdown.
The winter season will provide opportunities for both airlines and hospitals.
We expect Mavi Giyim (MAVI:IS) to announce strong financials in the second quarter.
Export data favors the company of Yunsa (YUNSA:IS).
Turkish Airlines Traffic Data in August


The total number of passengers of Turkish Airlines (THYAO:IS) increased by 32% YoY to 7.8 million passengers in August 2022, which indicates a 6% growth compared to the August 2019 level. The number of domestic passengers contracted by 2% YoY, while the number of international passengers increased by 62% YoY. Compared to the July data, it is observed that the passenger growth rate slowed down YoY (43% growth YoY; 10% growth compared to 2019 in July).
The load factor (LF) increased by 1290 bps YoY to 86.1% in August 2022 (130 bps increase, compared to the August 2019 level). The slowdown is also observed here. In July, the load factor was increased by 290 bps, compared to 2019 level. On the other hand, cargo and mail volumes decreased by 8% YoY.


Looking at the more recent Eurocontrol data, it can be said that there is positive momentum for Turkish Airlines. If we exclude low-cost carriers (LCCs) such as Ryanair and easyJet (which are not direct competitors for the company), amongst the flagship carriers, Turkish Airlines managed to become the first airline in Europe with an average of 1,488 daily flights during the 35th week of the year (29 Aug-4 Sept). This level indicates an increase of 3% weekly and 1% compared to the same week of 2019. Likewise, Turkish Airlines ranked first with an average of 1,491 flights in the 36th week of the year (5 Sept-11 Sept). This level indicates a flat performance weekly, and a 4% increase compared to the same week of 2019. As another important factor, the companies following Turkish Airlines in the list (Lufthansa Airlines, Air France Group) have experienced sharp decreases compared to their 2019 levels. If we look at the overall outlook and momentum, we expect Turkish Airlines to continue its recovery and announce strong financials in the coming quarters.
The Winter Season Mobility as a Further Catalyst
The upcoming winter season carries huge importance and creates opportunities for Turkish tourism and airline industries. According to the reports and booking data, it is highly likely that many European tourists (especially retirees) will prefer Turkey for their holidays this winter season. The energy crisis in Europe and weaker TRY are some reasons behind the interest. Furthermore, this winter season is the first one without pandemic restrictions since 2019. Tourism professionals said that current booking data reached 2019 levels (demand is strong for November, especially). According to the tour operators, it is expected that 1 to 3 million European tourists may prefer the holiday in Turkey this winter, considering the current flight capacity. Seeking to benefit from these dynamics, the hotels are planning to be open this winter season. Even some hotels are turning their concept into hostels to reduce their costs. The city of Antalya is expected to be the main destination for European retirees. Undoubtedly, this phenomenon will serve as a further catalyst for the airlines.
In addition to the entertainment-focused tourism preferences, it should be noted that the demand for health tourism in Turkey is expected to grow fast this winter. Weaker TRY, the geopolitical position of Turkey (proximity to the key centers), and the advanced private hospital network that offers complex and diversified treatments (accredited high-quality facilities) are the main reasons behind the health tourism boom. Evidently, Turkish hospitals are aware of this situation and try to attract more attention from tourists and increase their share in the global health tourism sector. For example, the revenue of Medical Park (MPARK:IS) from health tourism increased by 178% in TRY terms (+47.5% in USD terms) YoY in the second quarter and increased by 186% in TRY terms (+51.8% in USD terms) in the first half of the year. Medical Park is the largest private healthcare service provider in the country in terms of the number of hospitals, beds, and geographic coverage. The company stated that increasing international flight numbers is important for revenue growth. The share of health tourism revenues in total stands at 16%. It was 5% at the end of 2016, and 12% at the end of 2021. The foreign patients of Medical Park came from diversified regions; 25% from Europe, 27% from the Middle East & Africa, and 48% from Former CIS & others. Lokman Hekim Hospitals (LKMNH:IS), another Turkish hospital group also tries to attract foreign attention. The company’s health tourism revenue increased by 112%, and the share of health tourism revenues in total revenues of the company stands at 12.1% in the first half of the year. It was 10.3% in the last year. Lokman Hekim Hospitals declared that its strategic aim is to increase the share of health tourism revenue in the coming years. The company took over a hospital this year which is close to the airport to attract tourist attention easier.
To conclude, this winter season, which is the first one without pandemic restrictions since 2019 will be very important for tourism and related industries.
Positive Outlook for Mavi Giyim
The company will announce its second-quarter results on September 19th*. Mavi Giyim was established in 1991 in Istanbul as a denim-centric ready-to-wear company and has been publicly traded since 2017 in Borsa Istanbul. Mavi’s line of business includes the wholesale and retail sales of ready-to-wear apparel to the customers. As of today, it operates in more than 30 countries including the US, Canada, Germany, and Australia. As of the end of the first quarter of 2022, the Company has 457 mono-brand stores (399 in Turkey, 58 in other countries). In total, it has ~4,500 points of sale globally.
The company does not engage in any production activity. Its diversified supplier network manufactures the products and makes them ready for sale. This supplier network includes more than 120 main suppliers and 485 sub-suppliers. It is important to note that 80% of Mavi’s supply chain locates in Turkey which means that the company is close to them. In the production process, apparel’s design & development phase is directly performed by Mavi itself. In addition, the selection of fabric & raw materials is controlled by the company. After these processes, the phase of production (cutting, sewing, and washing) is delegated to the manufacturers.
The company’s consolidated revenue reached 1,887 million TRY in the first quarter, growing 149% YoY. The global revenues came from retail (61%), wholesale (26%), and e-commerce (13%) categories (80% of all revenues came from Turkey). Both price increases and volume growth supported the revenues. Volume growth was realized in almost all product categories in Turkey. The company sold 3.3 million denim items globally which indicates 50% growth. In terms of product categories, denim items constitute 45% of all sales (denim category growth 189% YoY), and the rest is lifestyle category sales (lifestyle category growth 209% YoY). International sales growth was realized as 13% in FX-adjusted terms.
We forecast that the company’s revenue will reach at least 2.65 billion TRY which indicates a very strong growth (40% QoQ, and 146% YoY).
The reasons for our positive expectations are following:
i) Mavi Giyim has a unique and strong brand image with its products positioned between the upper end of the core segment and the premium segment of the ready-to-wear market.
ii) The effects of high inflation on the customers in Turkey favor the company, which front-load its demand for goods (especially consumer-cyclical goods).
iii) Due to its cost structure (mostly in TRY terms), the company can offer competitive pricing for the customers, compared to its international competitors, preferring FX-based pricing.
iv) After COVID-19, there has been a growing interest in casual wear in offices, and it continues to support the jeans market.
We forecast that there may be partial pullbacks in the company’s margins, both gross profit margin, and net profit margin. In the first quarter, due to the less markdown offers, gross profit margin reached 56.5% with a 710 basis point improvement YoY. Its EBITDA margin reached 29.5%, the highest-ever quarterly. The reason behind the less markdown offers is that the demand in Turkey is very strong due to the front-loading of demand. Our minimum net profit forecast is 320 million TRY, which indicates 215% growth YoY.
* For the company, the fiscal year is between February 1 – January 31 (in line with the business seasons of the apparel industry). The second quarter is between May and July.
Export Data Favors Yunsa
According to the data of the Istanbul Textile and Raw Materials Exporters' Association (İTHİB), Turkey's woolen woven fabric exports increased by 47% in dollar terms in August. It is quite positive for Yünsa, which is one of the five largest upper segment woolen woven fabric manufacturers in the world and makes a significant part of this export. The company is the largest woven fabric manufacturer in Europe under one roof. It signals that Yünsa will continue to announce strong financials in the upcoming period.

This was our first article so we'd love to hear your thoughts and feedback, so please leave a comment down below. And if you liked what you read, we'd really appreciate if you hit the like button below, shared with your friends and colleagues and subscribed. Cheers!
Sources:
Disclaimer:
The articles on this website are for informational purposes only, you should not construe any such information or other material as legal, tax, investment, financial, or other advice.